Current account posts large surplus in October
Current account
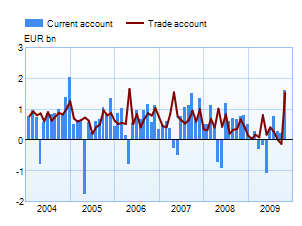
The current account posted a surplus of EUR 1.6 billion in October 2009, compared with EUR 0.7 billion a year earlier. The large surplus in October this year was due to the completion of a record-breaking cruise liner contract. The substantial surplus in October will have a positive impact on the current account for 2009 as a whole, and the surplus from the beginning of the year (January – October) is EUR 2.0 billion, compared with EUR 4.3 billion for the same period in 2008. |
 |
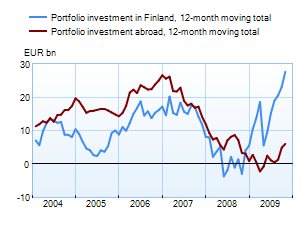
Financial account and international investment position Capital inflows in October exceeded outflows by EUR 6.0 billion. Since the beginning of the year (January – October) there has been a net capital inflow of EUR 21.0 billion. In October, there was a net inflow of EUR 4.8 billion in portfolio investment, of which government bonds and money market instruments accounted for EUR 4.7 billion. Direct investment and other investments (loans, deposits and trade credits) each recorded a net capital inflow of EUR 0.4 billion. There was also a net capital inflow of EUR 0.3 billion from derivatives trading. |
 |
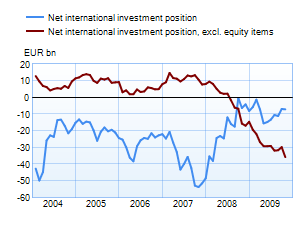
At the end of October, Finnish residents’ foreign liabilities exceeded their foreign assets by EUR 7.2 billion. Gross assets amounted to EUR 423 billion, and gross liabilities to EUR 430 billion. The external liabilities of non-financial corporations, monetary financial institutions (MFIs), central government and local government exceeded their external assets. In contrast, the external assets of other financial institutions, employment pension funds and households exceeded their external liabilities. At the end of October, Finnish residents’ securities-based liabilities exceeded their securities-based assets by EUR 37.1 billion. Other liabilities (loans, deposits and trade credits) also exceeded assets, in the amount of EUR 6.2 billion. In contrast, direct investment assets exceeded liabilities by EUR 26.8 billion. |
 |
Year 2008, |
September 2009, EUR million |
October 2009, EUR million |
12 month moving sum, EUR million | |
| Current account | 5,566 | 221 | 1,614 | 3,268 |
| Goods | 5,862 | -121 | 1,525 | 3,976 |
| Services | 1,840 | 307 | 153 | 1,431 |
| Income | -550 | 148 | 145 | -628 |
| Transfers | -1,585 | -112 | -208 | -1,512 |
| Capital account* | 167 | – | – | – |
| Financial account | 6,242 | -3,273 | 5,989 | 24,892 |
| Direct investment | -7,179 | 579 | 392 | 2,425 |
| Portfolio investment** | 4,629 | 1,118 | 4,769 | 21,603 |
| Other investment | 7,408 | -5,793 | 436 | -2,890 |
| Reserve assets | -192 | 105 | 106 | -301 |
| Financial derivatives | 1,576 | 718 | 286 | 4,055 |
| Errors and omissions | -11,975 | 3,052 | -7,603 | -28,188 |
The statistics become final more than two years after the end of the reference year.
* Capital account is not estimated monthly. The figures are published first after the yearly data are prepared.
** Beginning with the data on the stock of portfolio investment in December 2008, the statistics on portfolio investment are based on security-by-security data collection. Because of the change in statistical methodology, the figures from January onwards are not entirely comparable with earlier periods.
More information
Anne Turkkila tel. +358 10 831 2175, email firstname.surname(at)bof.fi