Balance of payments, September 2010
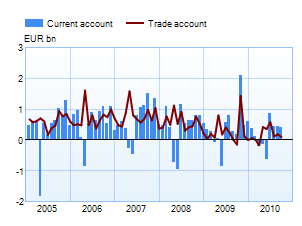
Current account
|
 |
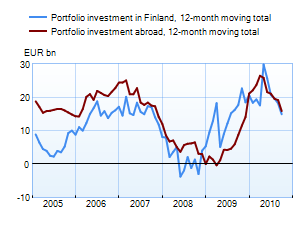
Financial account
|
 |
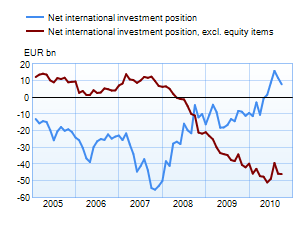
Net international investment position at
|
 |
Finland's balance of payments
Year 2009, |
August 2010, EUR million |
September 2010, EUR million |
12 month moving sum, EUR million | |
| Current account | 4,696 | 449 | 396 | 4,806 |
| Goods | 3,395 | 186 | 103 | 3,230 |
| Services | 1,329 | 90 | 56 | 1,712 |
| Income | 1,661 | 293 | 357 | 1,564 |
| Transfers | -1,689 | -120 | -120 | -1,700 |
| Capital account | 145 | 12 | 12 | 145 |
| Financial account | 11,011 | 6,542 | 1,662 | 4,773 |
| Direct investment | -2,762 | 72 | -27 | -2,758 |
| Portfolio investment | -513 | -2,008 | -921 | -929 |
| Other investment | 12,669 | 9,061 | 2,006 | 7,415 |
| Reserve assets | -614 | 269 | 94 | 897 |
| Financial derivatives | 2,231 | -851 | 509 | 149 |
| Errors and omissions | -15,852 | -7,004 | -2,070 | -9,724 |
The statistics become final more than two years after the end of the reference year.
For more information, please contact: Jaakko Suni tel. +358 10 831 2454, email firstname.surname(at)bof.fi