Current account still in surplus in 2009
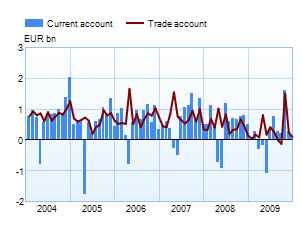
Current account
The current account posted a surplus of EUR 0.1 billion in December 2009. For 2009 as a whole there was a surplus of EUR 2.4 billion. This was less than half the surplus for 2008, and represents 1.4 % of GDP. The surplus for 2009 was considerably boosted by the completion of a large cruise liner contract in October. The annual current account figures have been in surplus for the past 16 years, but the last time the surplus was so small was in 1994. The small surplus is largely due to weaker figures for the goods account. The income account, which includes both capital income (such as dividend and interest income) and employee compensation, posted a deficit of EUR 1.2 billion in 2009. This was twice the deficit in 2008. In portfolio investment, there was a net outflow of EUR 1.2 billion in interest payments on debt instruments, EUR 0.6 billion more than in 2008. In contrast, the net outflow of dividend payments on shares totalled EUR 1.9 billion, or EUR 0.8 billion less than in 2008. In direct investment, net dividend and interest income amounted to EUR 1.6 billion, compared with EUR 2.3 billion in 2008. |
 |
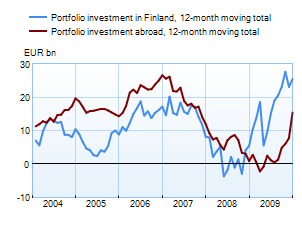
Financial account and international investment position In 2009, there was a net inflow of capital into Finland in the amount of EUR 20.6 billion. This was more than three times the net inflow in 2008. There was a net inflow of capital in portfolio investment and other investment (loans, deposits and trade credits) in the amounts of EUR 10 billion and EUR 9.6 billion respectively. In direct investment, there was a net capital outflow of EUR 0.6 billion. There was also a net capital inflow of EUR 2.2 billion from derivatives trading. |
 |
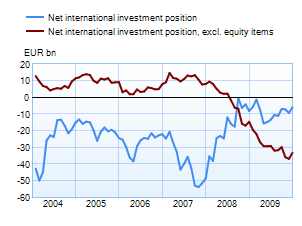
At the end of 2009, Finnish residents’ foreign liabilities exceeded their foreign assets by EUR 6 billion. Gross assets amounted to EUR 439 billion, and gross liabilities to EUR 445 billion. The external liabilities of non-financial corporations, monetary financial institutions (MFIs), central government and local government exceeded their external assets. Central government took on more external debt in 2009, in the net amount of EUR 15 billion, EUR 9 billion from bond issues and EUR 6 billion from money market instruments. In contrast, the external assets of other financial institutions, employment pension funds and households exceeded their external liabilities. At the end of 2009, Finnish residents’ securities-based liabilities exceeded their securities-based assets by EUR 35 billion. Other liabilities (loans, deposits and trade credits) also exceeded assets, in the amount of EUR 10 billion. In contrast, direct investment assets exceeded liabilities by EUR 28 billion. |
 |
1 The data on goods in the balance of payments statistics differs from the foreign trade statistics published by the National Board of Customs due to the adjustment for freight and insurance expenditure. In the BOP statistics, the component of CIF-valued imports in the foreign trade statistics attributable to foreign carriers and insurers is transferred to freight and insurance expenditure.
2 The figures on trade in goods and services in 2008 and 2009 published by Statistics Finland and the Bank of Finland differ from each other due to differing schedules for statistical revisions.
Finland's balance of payments
Year 2008, |
November 2009, EUR million |
December 2009, EUR million |
12 month moving sum, EUR million | |
| Current account | 5,566 | 266 | 126 | 2,367 |
| Goods | 5,862 | 245 | 99 | 3,702 |
| Services | 1,840 | 149 | 155 | 1,327 |
| Income | -550 | -135 | 79 | -1,150 |
| Transfers | -1,585 | 7 | -208 | -1,512 |
| Capital account* | 167 | – | – | – |
| Financial account | 6,242 | 1,985 | -2,409 | 20,583 |
| Direct investment | -7,179 | -418 | -600 | -598 |
| Portfolio investment** | 4,629 | 2,481 | -3,994 | 10,013 |
| Other investment | 7,408 | 186 | 2,296 | 9,551 |
| Reserve assets | -192 | -78 | -357 | -614 |
| Financial derivatives | 1,576 | -187 | 246 | 2,230 |
| Errors and omissions | -11,975 | -2,250 | 2,283 | -22,950 |
The statistics become final more than two years after the end of the reference year.
* Capital account is not estimated monthly. The figures are published first after the yearly data are prepared.
** Beginning with the data on the stock of portfolio investment in December 2008, the statistics on portfolio investment are based on security-by-security data collection. Because of the change in statistical methodology, the figures from January onwards are not entirely comparable with earlier periods.
More information
Anne Turkkila tel. +358 10 831 2175, email firstname.surname(at)bof.fi