Finland’s current account and international investment flows in the first quarter of 2010
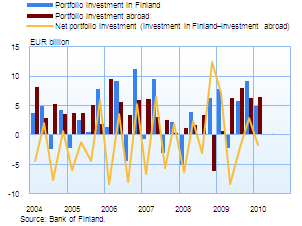
Portfolio investment flows outward again
Portfolio investment in the period January–March was outward on net, in the amount of EUR 1.6 billion: Finnish investors increased their portfolio investment abroad by EUR 6.5 billion and foreign investors correspondingly their portfolio investment in Finland by EUR 4.9 billion. Consequently, the trend in investment flows has reversed since the fourth quarter of last year, when there was an inflow of EUR 2.9 billion. More than half of the outward portfolio investment was in foreign investment fund shares, to a total value of EUR 3.7 billion. The rest was almost equally divided between debt securities and shares. Nearly all Finnish investor sectors were engaged in portfolio investment abroad, with the strongest increases in foreign holdings being observed for investment funds registered in Finland, pension providers and insurance companies. At the end of March 2010, the market value of foreign securities held by Finnish residents was EUR 179.5 billion, and the largest holdings were recorded for pension providers and for other social security funds, in the total amount of EUR 73.9 billion. Inflows in portfolio investment were mainly composed of investment in Finnish debt securities, which were sold abroad to the value of EUR 3.8 billion in net terms. Non-residents invested EUR 6.3 billion and EUR 2.6 billion in Finnish government long-term bonds and in securities issued by MFIs, respectively. By contrast, money market paper issued by both the central government and MFIs were resold abroad and redeemed. Net sales abroad of investment fund shares totalled EUR 1.6 billion. Shares issued by Finnish non-financial corporations were repurchased from abroad to some extent, on net. The market value of portfolio investment liabilities, ie foreign portfolio investment in Finland, was EUR 216.6 billion at the end of March 2010. Viewed by debtor category, the largest portfolio investment liabilities were held by non-financial corporations, to the total value of EUR 81.7 billion. This, in turn, was mostly composed of share holdings by foreign investors, totalling EUR 63.8 billion. |
 |
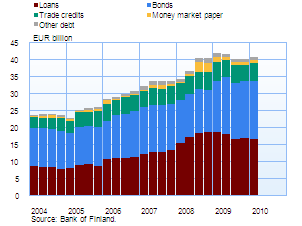
Corporate foreign liabilities (excl. direct investments and equity items) were a good EUR 40 billion at the end of the first quarter of 2010.The most important items by far were loans and bonds, which each reached about EUR 17 billion by the first quarter of 2010. Corporate foreign liabilities increased strongly in 2008, but fell to their current levels in the third quarter of 2009. This was essentially due to loans granted to non-financial corporations, which increased significantly in 2008, maintained their level of the third quarter of 2008 at the onset of the international financial crisis and declined in the course of the second and third quarter of 2009. |
 |
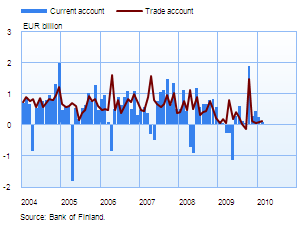
Current account in slight surplusIn the first quarter of 2010, the current account surplus amounted to EUR 35 million. In the same period last year, there had been a deficit of EUR 49 million. In BOP terms, the balance of trade posted a surplus of EUR 126 million, while a surplus of EUR 302 million had been recorded in the first quarter of last year. The surplus on services was EUR 350 million. The income account, which is mainly composed of capital income, such as dividend and interest income, as well as employee compensation showed a deficit of EUR 19 million, which is EUR 7 million larger than the deficit recorded in the same period of the previous year.
Finland’s balance of payments in March 2010
|
 |
Finland's balance of payments
Year 2009, |
February 2010, EUR million |
March 2010, EUR million |
12 month moving sum, EUR million | |
| Current account | 2,263 | 74 | -308 | 2,347 |
| Goods | 3,517 | 101 | -79 | 3,340 |
| Services | 1,546 | 123 | 92 | 1,814 |
| Income | -1,129 | -10 | -180 | -1,136 |
| Transfers | -1,671 | -141 | -141 | -1,671 |
| Capital account | 145 | 12 | 12 | 145 |
| Financial account | 13,475 | -3,926 | 4,431 | 8,952 |
| Direct investment | -248 | 738 | 72 | 1,528 |
| Portfolio investment | -502 | -537 | 1,597 | -9,213 |
| Other investment | 12,066 | -4,105 | 2,692 | 16,515 |
| Reserve assets | -614 | -598 | -39 | -667 |
| Financial derivatives | 2,773 | 575 | 108 | 788 |
| Errors and omissions | -15,883 | 3,840 | -4,135 | -11,444 |
The statistics become final more than two years after the end of the reference year.
For more information, please contact: Anne Turkkila tel. +358 10 831 2175, email firstname.surname(at)bof.fi