Finland’s current account and international investment flows in 2009
Surplus on services balance increased by EUR 0.5 billion
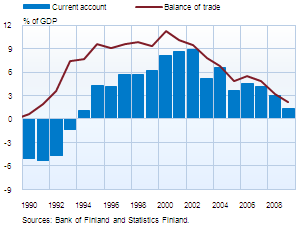
The current account posted a surplus of EUR 2.3 billion in 2009, which represented a contraction to EUR 1.3% of GDP. Current account receipts decreased by some 29% from a year earlier, to EUR 74 billion, and current account expenditures fell by about 27% to EUR 72 billion. In the previous recession of the 1990s, the largest fall in current account receipts and expenditures occurred in 1991, when the former declined by over 7% and the latter by about 7% year-on-year. In 2009, foreign trade in services contracted less than in goods, in relative terms. The surplus on services increased by EUR 0.5 billion to EUR 1.5 billion. Exports of services decreased by 18% from a year earlier and totalled EUR 17.9 billion. Income from royalties and licence fees increased by 16% year-on-year, whereas income from other services items decreased by 20%. Imports of services contracted by 21% to EUR 16.3 billion. Expenditures arising from travel increased by about 3% year-on-year, whereas expenditure from other services items declined by 26%. |
 |
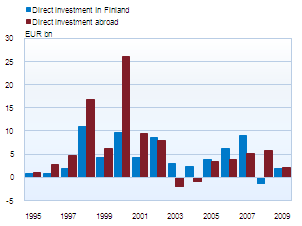
Direct investment was mutedPreliminary data indicate that direct investment flows were relatively subdued in 2009. Inward direct investment roughly equalled outward direct investment. Finland’s direct investment inflows amounted to about EUR 1.8 billion in 2009, which is EUR 2.1 billion less than the average for the last 5 years. Nevertheless, direct investment inflows increased compared to 2008, when foreign investors relocated direct investment capital from Finland by EUR 1.3 billion more than they invested in Finland. In 2009, foreign investors’ net equity investment in Finland totalled EUR 1.9 billion, and net withdrawals of other direct investment capital from Finland amounted to EUR 0.1 billion. Finland’s direct investment outflows amounted to about 2.1 billion in 2009, which is EUR 1.4 billion less than the average for the last 5 years and EUR 3.7 billion less than the outflow in 2008. Finnish investors’ net equity investment abroad totalled EUR 4.1 billion, and net withdrawal of other direct investment capital from foreign investment enterprises amounted to EUR 2 billion. |
 |
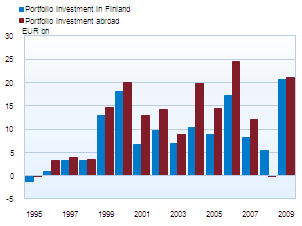
Inward and outward portfolio investment picked up againFinnish investors increased their portfolio investment abroad by EUR 21 billion, which was close to the peak level of 2006. Half of portfolio investment was in bonds, and the other half in equity shares and investment fund shares. At the end of 2009, the market value of foreign securities held by Finnish residents was EUR 167 million. This was not yet at the levels observed prior to the fall in market prices. Of all Finnish investors, banks, investment funds and employment pension funds increased their foreign portfolio investment the most. Foreign investors invested a record EUR 21 billion in Finnish securities in 2009. Half of this was invested in government bonds and money market paper, and about a third in MFI debt securities. The stock of debt securities totalled EUR 129 billion, of which about half was in securities issued by the central government and the remaining half was in securities issued by MFIs and enterprises. Foreign investors sold their holdings of Finnish equity securities on net. At the end of 2009, the market value of equity shares of Finnish enterprises held by foreign investors totalled about EUR 64 billion – a level last recorded in the 1990s. |
 |
Finland’s balance of payments in January 2010
- Current account surplus unchanged from a year earlier.
- Net inflow of capital EUR 2.9 billion.
- Net inflow of direct investment EUR 0.2 billion.
- Net outflow of portfolio investment EUR 2.4 million.
- Net inflow of capital via other investments (loans, deposits and trade credits) EUR 3.9 billion.
Finland's balance of payments
Year 2009, |
December 2009, EUR million |
January 2010, EUR million |
12 month moving sum, EUR million | |
| Current account | 2,263 | 445 | 268 | 2,389 |
| Goods | 3,517 | 66 | 106 | 3,564 |
| Services | 1,546 | 421 | 127 | 1,638 |
| Income | -1,129 | 90 | 176 | -1,143 |
| Transfers | -1,671 | -132 | -141 | -1,671 |
| Capital account | 145 | 12 | 12 | 145 |
| Financial account | 13,475 | -1,797 | 2,941 | 15,310 |
| Direct investment | -248 | -585 | 240 | -1,145 |
| Portfolio investment | -502 | -3,093 | -2,378 | -3,415 |
| Other investment | 12,066 | 2,168 | 3,923 | 17,926 |
| Reserve assets | -614 | -357 | 679 | 6 |
| Financial derivatives | 2,773 | 70 | 477 | 1,938 |
| Errors and omissions | -15,883 | 1,341 | -3,221 | -17,844 |
More information
Jaakko Suni tel. +358 10 831 2454, email firstname.surname(at)bof.fi