The current account posts a deficit in the seven months to July
Current account
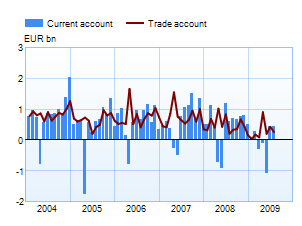
The current account posted a surplus of EUR 0.4 billion in July 2009, compared with EUR 0.6 billion in July 2008. For the 12 month period August 2008–July 2009, the current account surplus was EUR 3.1 billion, compared with EUR 7.3 billion for the 12 months to July 2008. In January–July 2009, however, the current account posted a deficit of 0.3 billion, compared with a surplus of EUR 2.2 billion in the year-earlier period. In BOP terms, there was a EUR 260 million surplus on goods in July. Both imports and exports were down by a more than one third from July 2008. The services account posted a surplus of EUR 48 million, the income account a surplus of EUR 258 million and the transfers account a deficit of EUR 122 million. |
 |
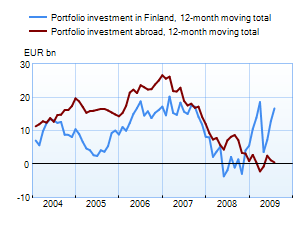
Financial account and international investment position Capital inflows exceeded outflows by EUR 4.9 billion in July. Portfolio investment and other investment (loans, deposits and trade credits) were inward on net, in the amounts of EUR 1.6 billion and EUR 3.5 billion, respectively, whereas direct investment was outward on net, in the amount of EUR 0.2 billion. In respect of derivatives, there was a net capital inflow of EUR 0.3 billion. |
 |
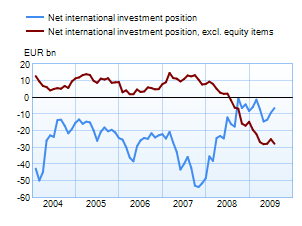
At the end of July, Finland’s net investment position was a negative EUR 6.4 billion. Gross assets amounted to EUR 408 billion, and gross liabilities were EUR 415 billion. The external liabilities of non-financial corporations, monetary financial institutions (MFIs), central government and local government exceeded external assets. In contrast, the external assets of other financial institutions, employment pension funds and households exceeded external liabilities. Securities-based liabilities and other liabilities (loans, deposits and trade credits) exceeded assets, in the amount of EUR 36.9 billion and EUR 6.8 billion, respectively, whereas direct investment assets exceeded liabilities, in the amount of EUR 27.8 billion. At the end of July 2009, Finland's net international investment position excluding equity items was a negative EUR 27.8 billion, reflecting an increase in Finland’s net debt of about EUR 30 billion since the summer of 2008. Apart from recent months, Finland’s net debt was last this high in the late 1990s. |
 |
Year 2008, |
June 2009, EUR million |
July 2009, EUR million |
12 month moving sum, EUR million | |
| Current account | 5,566 | 442 | 444 | 3,116 |
| Goods | 5,862 | 429 | 260 | 4,058 |
| Services | 1,840 | -43 | 48 | 993 |
| Income | -550 | 145 | 258 | -351 |
| Transfers | -1,585 | -89 | -122 | -1,585 |
| Capital account* | 167 | – | – | – |
| Financial account | 6,242 | 1,571 | 4,887 | 22,611 |
| Direct investment | -7,179 | -120 | -205 | 1,085 |
| Portfolio investment** | 4,629 | 5,579 | 1,638 | 16,176 |
| Other investment | 7,408 | -3,056 | 3,468 | 964 |
| Reserve assets | -192 | -583 | -323 | -811 |
| Financial derivatives | 1,576 | -248 | 308 | 5,197 |
| Errors and omissions | -11,975 | -2,013 | -5,331 | -25,796 |
The statistics become final more than two years after the end of the reference year.
* Capital account is not estimated monthly. The figures are published first after the yearly data are prepared.
** Beginning with the data on the stock of portfolio investment in December 2008, the statistics on portfolio investment are based on security-by-security data collection. Because of the change in statistical methodology, the figures from January onwards are not entirely comparable with earlier periods.
More information
Jaakko Suni tel. +358 10 831 2454, email firstname.surname(at)bof.fi