Slight current account deficit in August 2009
Current account
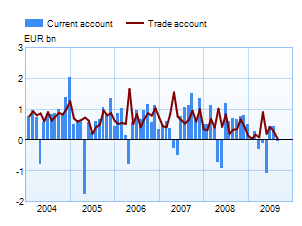
The current account posted a deficit of EUR 0.1 billion in August 2009, compared with a surplus of EUR 0.7 billion in August 2008. For the 12-month period (September 2008 – August 2009), the current account surplus was EUR 2.3 billion, compared with EUR 6.8 billion for the 12 months to August 2008. In BOP terms, there was a EUR 34.5 million surplus on goods1 in August. Both exports and imports were down by a more than one third from August 2008. The services account posted a surplus of EUR 53 million, the income account a surplus of EUR 38 million and the transfers account a deficit of EUR 185.6 million. |
 |
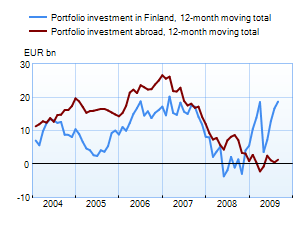
Financial account and international investment position Net capital inflows exceeded outflows by EUR 0.7 billion in August. In the early part of the year (January−August), net capital inflows totalled EUR 15.2 billion. In August, portfolio investment, other investment (loans, deposits and trade credits) and direct investment were inward on net in the amount of EUR 0.5 billion, EUR 0.4 billion and EUR 0.1 billion, respectively. With regard to derivatives, there was a net capital outflow of EUR 0.4 billion. |
 |
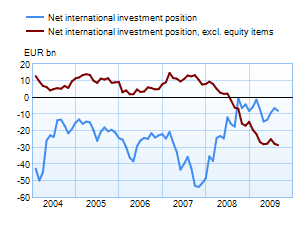
At the end of August, Finnish residents’ foreign liabilities exceeded their foreign assets by EUR 8.1 billion. Gross assets amounted to EUR 422 billion and gross liabilities EUR 430 billion. The external liabilities of non-financial corporations, monetary financial institutions (MFIs), central government and local government exceeded external assets. In contrast, the external assets of other financial institutions, employment pension funds and households exceeded external liabilities. Securities-based liabilities and other liabilities (loans, deposits and trade credits) exceeded assets, in the amount of EUR 38.3 billion and EUR 7.9 billion, respectively, whereas direct investment assets exceeded liabilities, in the amount of EUR 27.9 billion. At the end of August, Finnish residents’ foreign liabilities exceeded their foreign assets and Finland’s net international investment position (=gross liabilities - gross assets) excluding equity items was EUR 28.7 billion. |
 |
1 Due to an adjustment on freight and insurance, the data on goods trade in the BOP statistics differ from the foreign trade statistics published by the National Board of Customs. The share of foreign transporters and insurers as in the BOP statistics is deducted from the CIF value of goods imports in the National Board of Customs’ statistics and transferred to transport and insurance costs.
Year 2008, |
July 2009, EUR million |
August 2009, EUR million |
12 month moving sum, EUR million | |
| Current account | 5,566 | 445 | -60 | 2,363 |
| Goods | 5,862 | 261 | 34 | 3,758 |
| Services | 1,840 | 48 | 53 | 782 |
| Income | -550 | 258 | 38 | -592 |
| Transfers | -1,585 | -122 | -186 | -1,585 |
| Capital account* | 167 | – | – | – |
| Financial account | 6,242 | 4,922 | 684 | 22,935 |
| Direct investment | -7,179 | -205 | 116 | 292 |
| Portfolio investment** | 4,629 | 1,638 | 459 | 17,422 |
| Other investment | 7,408 | 3,503 | 354 | 1,355 |
| Reserve assets | -192 | -323 | 205 | -620 |
| Financial derivatives | 1,576 | 308 | -450 | 4,486 |
| Errors and omissions | -11,975 | -5,367 | -624 | -25,354 |
The statistics become final more than two years after the end of the reference year.
* Capital account is not estimated monthly. The figures are published first after the yearly data are prepared.
** Beginning with the data on the stock of portfolio investment in December 2008, the statistics on portfolio investment are based on security-by-security data collection. Because of the change in statistical methodology, the figures from January onwards are not entirely comparable with earlier periods.
More information
Anne Turkkila tel. +358 10 831 2175, email firstname.surname(at)bof.fi