Dividend outflow smaller than last year
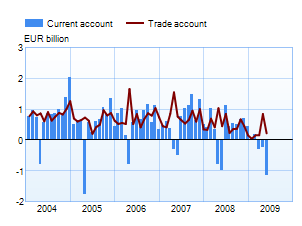
Current account
The current account posted a deficit of EUR 1.15 billion in May 2009, compared with EUR 0.98 billion a year earlier. For the 12 months June 2008 – May 2009, there was a current account surplus of EUR 2.84 billion, compared with EUR 6.86 billion for the 12 months to May 2008. The size of the current account deficit was influenced by the outflow of dividends. Dividends on portfolio investments are traditionally paid in April to May. At EUR 1.2 billion, the outflow of dividends on portfolio investment in Finland was more than 25% lower in May 2009 than in May 2008. In April to May this year, the net outflow of dividends was EUR 1.5 billion less than a year earlier. The inflow of dividends also declined in the early part of the year, being almost EUR 0.4 billion lower in January to May than a year earlier. In BOP terms, there was a EUR 219 million surplus on goods in May. Other current account items posted deficits: EUR 46 million on the services account, EUR 190 million on the current transfers account and EUR 1130 million on the income account. Dividends are included in the income account. |
 |
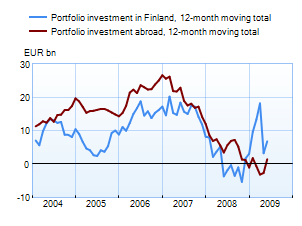
Financial account and international investment position Capital outflows in May 2009 exceeded inflows by EUR 0.63 billion. This was the first net outflow of capital since the repatriation of capital began last autumn. Finnish residents began to invest in foreign securities again in May, causing an upturn in the 12-month moving total of securities-based assets. Portfolio investment and other investment (loans, deposits and trade credits) were outward on net, in the amounts of EUR 0.24 billion and EUR 0.95 billion respectively. There was a net capital inflow of EUR 0.39 billion in direct investment, and EUR 0.18 billion in derivatives. |
 |
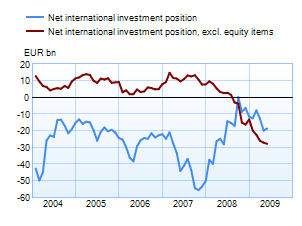
At the end of May, Finnish residents’ foreign liabilities exceeded their foreign assets by EUR 18.7 billion. Gross assets amounted to EUR 411 billion, and gross liabilities to EUR 430 billion. The external liabilities of non-financial corporations, monetary financial institutions (MFIs), central government and local government exceeded their external assets. In contrast, the external assets of other financial institutions, employment pension funds and households exceeded their external liabilities. At the end of May, Finnish residents’ securities-based liabilities exceeded their securities-based assets by EUR 40.5 billion. Other liabilities (loans, deposits and trade credits) also exceeded assets. In contrast, direct investment assets exceeded liabilities by EUR 18.9 billion. At the end of May, excluding equity items, Finnish residents’ foreign liabilities exceeded their foreign assets by EUR 27.9 billion. |
 |
Year 2008, |
April 2009, EUR million |
May 2009, EUR million |
12 month moving sum, EUR million | |
| Current account | 4,383 | -249 | -1,147 | 2,837 |
| Goods | 6,003 | 844 | 219 | 4,497 |
| Services | 1,593 | -42 | -46 | 1,090 |
| Income | -1,647 | -850 | -1,130 | -1,176 |
| Transfers | -1,566 | -200 | -190 | -1,574 |
| Capital account* | 166 | – | – | – |
| Financial account | 6,875 | 947 | -632 | 16,278 |
| Direct investment | -4,087 | 405 | 391 | -2,555 |
| Portfolio investment** | 4,120 | -12,193 | -236 | 5,388 |
| Other investment | 5,458 | 12,753 | -946 | 7,896 |
| Reserve assets | -192 | 231 | -16 | 105 |
| Financial derivatives | 1,576 | -251 | 175 | 5,444 |
| Errors and omissions | -11,424 | -698 | 1,779 | -19,212 |
The statistics become final more than two years after the end of the reference year.
* Capital account is not estimated monthly. The figures are published first after the yearly data are prepared.
** Beginning with the data on the stock of portfolio investment in December 2008, the statistics on portfolio investment are based on security-by-security data collection. Because of the change in statistical methodology, the figures from January onwards are not entirely comparable with earlier periods.
More information
Jaakko Suni tel. +358 10 831 2454, email firstname.surname(at)bof.fi