Current account posts EUR 0.4 billion surplus in June
Current account
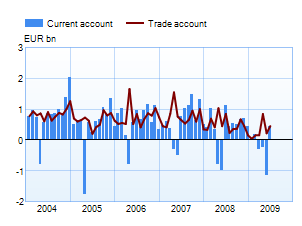
The current account posted a surplus of EUR 0.4 billion in June 2009, compared with EUR 1.1 billion in June 2008. For the 12 months July 2008 – June 2009 there was a current account surplus of EUR 2.2 billion, compared with EUR 7.2 billion for the 12 months to June 2008. In BOP terms, there was a EUR 454.8 million surplus on goods in June. Both imports and exports were down by more than a third from June 2008. The services account posted a deficit of EUR 46.9 billion, and the current transfers account a deficit of EUR 88.5 billion. The interest account posted a surplus of EUR 114.2 million. |
 |
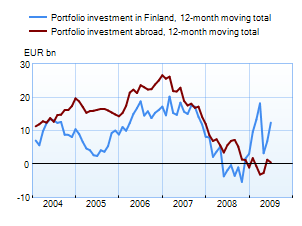
Financial account and international investment position Capital inflows in June exceeded outflows by EUR 2.5 billion. There was a net inflow of EUR 5.6 billion in portfolio investment and EUR 0.9 billion in direct investment. Other investments (loans, deposits and trade credits) recorded a net capital outflow of EUR 3.1 billion. Derivatives trading accounted for a net capital outflow of EUR 0.3 billion. Central government accounted for a net capital inflow of EUR 3.5 billion. |
 |
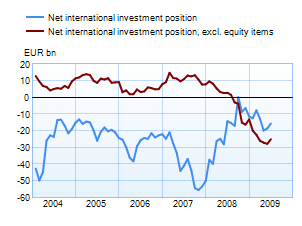
At the end of June, Finnish residents’ foreign liabilities exceeded their foreign assets by EUR 15.7 billion. Gross assets amounted to EUR 405 billion, and gross liabilities to EUR 421 billion. The external liabilities of non-financial corporations, monetary financial institutions (MFIs), central government and local government exceeded their external assets. In contrast, the external assets of other financial institutions, employment pension funds and households exceeded their external liabilities. At the end of June, Finnish residents’ securities-based liabilities exceeded their securities-based assets by EUR 41.8 billion. Other liabilities (loans, deposits and trade credits) also exceeded assets, in the amount of EUR 0.5 billion. In contrast, direct investment assets exceeded liabilities by EUR 17.8 billion. At the end of June, excluding equity items, Finnish residents’ foreign liabilities exceeded their foreign assets by EUR 25.1 billion. |
 |
Year 2008, |
May 2009, EUR million |
June 2009, EUR million |
12 month moving sum, EUR million | |
| Current account | 4,383 | -1,146 | 434 | 2,152 |
| Goods | 6,003 | 220 | 455 | 4,105 |
| Services | 1,593 | -45 | -47 | 914 |
| Income | -1,647 | -1,130 | 114 | -1,290 |
| Transfers | -1,566 | -190 | -88 | -1,577 |
| Capital account* | 166 | – | – | – |
| Financial account | 6,875 | -501 | 2,545 | 19,945 |
| Direct investment | -4,087 | 392 | 866 | -1,414 |
| Portfolio investment** | 4,120 | -106 | 5,566 | 11,917 |
| Other investment | 5,458 | -946 | -3,056 | 4,940 |
| Reserve assets | -192 | -16 | -583 | -465 |
| Financial derivatives | 1,576 | 175 | -248 | 4,968 |
| Errors and omissions | -11,424 | 1,647 | -2,979 | -22,180 |
The statistics become final more than two years after the end of the reference year.
* Capital account is not estimated monthly. The figures are published first after the yearly data are prepared.
** Beginning with the data on the stock of portfolio investment in December 2008, the statistics on portfolio investment are based on security-by-security data collection. Because of the change in statistical methodology, the figures from January onwards are not entirely comparable with earlier periods.
More information
Anne Turkkila tel. +358 10 831 2175, email firstname.surname(at)bof.fi