Current account posts a slight surplus in February 2009
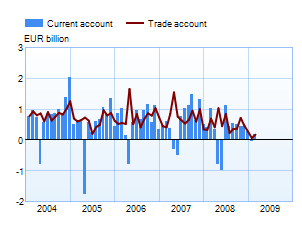
Current accountThe current account posted a surplus of EUR 0.2 billion in February 2009, compared with a surplus of EUR 1.03 billion a year earlier. For the twelve months March 2008 – February 2009 the current account had a surplus of EUR 2.48 billion.
|
 |
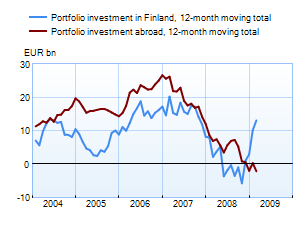
Financial account and international investment position Net capital inflows in February exceeded outflows by EUR 2.2 billion. There was a net inflow of EUR 0.9 billion in portfolio investment and EUR 1.1 billion in other investment (loans, deposits and trade credits). Direct investment recorded a net capital outflow of EUR 1.0 billion. The net capital inflow into Finland arising from derivatives contracts totalled EUR 1.2 billion. The 12-month moving total of portfolio investment outflows has been declining since the end of 2006, apart from a couple of exceptional months. The trend continued in February, and capital was repatriated in the amount of EUR 1.2 billion. The 12-month moving total of portfolio investment inflows has also declined since the end of 2006. The 12-month moving total of investment flows has been positive again in recent months, meaning that portfolio investment inflows have exceeded capital repatriations. However, in the latest month (February 2009), capital repatriations exceeded investment flows by EUR 0.2 billion.
|
 |
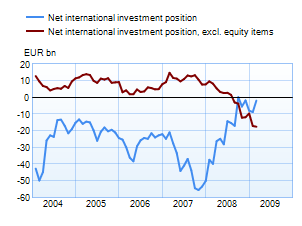
At the end of February 2009, Finnish residents' external liabilities exceeded their external assets by EUR 1.9 billion. The upward trend in net assets that began towards the end of 2007 has been due to a decline in the market value of Finnish listed companies that has lowered the value of foreigners' holdings in them. In the most recent months, gross foreign debt has begun to increase again, partly because of foreign borrowing by the central government. Excluding equity items, Finnish resident's external liabilities exceeded their external assets by EUR 17.6 billion at the end of February 2009. Portfolio investment statistics are based on security-by-security data collection starting with stock data as of December 2008. Because of the change in statistical methodology, the figures for 2009 are not entirely comparable with earlier periods. |
 |
Year 2008, |
January 2009, EUR million |
February 2009, EUR million |
12 month moving sum, EUR million | |
| Current account | 3,789 | -65 | 191 | 2,478 |
| Goods | 6,192 | 69 | 177 | 5,411 |
| Services | 778 | -66 | -70 | 484 |
| Income | -1,623 | 105 | 6 | -1,858 |
| Transfers | -1,559 | -173 | 78 | -1,559 |
| Capital account* | 165 | – | – | – |
| Financial account | 7,821 | 3,232 | 2,214 | 15,129 |
| Direct investment | -3,979 | 1,124 | -973 | -3,926 |
| Portfolio investment** | 4,939 | 3,480 | 932 | 15,257 |
| Other investment | 5,466 | -2,019 | 1,093 | -169 |
| Reserve assets | -192 | 60 | -71 | -161 |
| Financial derivatives | 1,587 | 588 | 1,232 | 4,128 |
| Errors and omissions | -11,774 | -3,167 | -2,405 | -17,745 |
The statistics become final more than two years after the end of the reference year.
* Capital account is not estimated monthly. The figures are published first after the yearly data are prepared.
** Beginning with the data on the stock of portfolio investment in December 2008, the statistics on portfolio investment are based on security-by-security data collection. Because of the change in statistical methodology, the figures from January onwards are not entirely comparable with earlier periods.
More information
Anne Turkkila +358 10 831 2175, email firstname.surname(at)bof.fi