Current account posted a deficit in March 2009
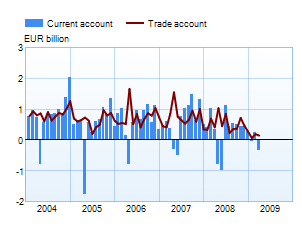
Current accountThe current account posted a deficit of EUR 353 mn in March 2009. A year earlier, the current account had recorded a surplus of EUR 338 mn. For the twelve months (from April 2008 to March 2009) the current account surplus was EUR 1,82 bn, after having still been EUR 7,82 bn a year ago. In BOP terms, there was a EUR 148 mn surplus on goods.1The net outflow in dividend and interest payments in March amounted to EUR 267 mn. |
 |
Financial account and international investment position
In March, capital inflows were on net EUR 5,4 bn higher than outflows. Net capital inflows in portfolio investment totalled EUR 7,5 bn, following issuance of bonds and notes as well as short-term money market instruments by the central government, non-financial corporations and other financial institutions. The central government issued long-term bonds, while repaying debt in short-term money market instruments. Direct investment and other investment – loans, deposits and trade credits – recorded a net outflow of EUR 2,0 bn. Over the last five months, the exceptionally large net inflow of capital, arising from financial derivatives, reversed and capital flows were outward on net in the amount of EUR 0,2 bn in March.
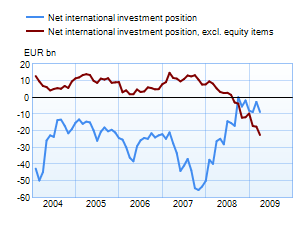
At the end of March, Finnish residents' external liabilities were EUR 9 bn more than their external assets. The amount of gross liabilities and gross assets totalled EUR 429 bn and EUR 420 bn respectively. External gross liabilities as a whole have increased approximately by 3% over the last twelve months, although the falling market valuations of Finnish listed companies have reduced the debt. Gross assets have grown approximately by 8%.
Direct investment and their share of gross liabilities have remained almost the same as a year ago. The value of portfolio investment has dropped by approximately 22%, and their share of gross liabilities has plunged from more than half to 40%. The stock of liabilities in equity has decreased to less than half, whereas the stock of debt securities has increased by just under one fifth to EUR 114 bn during the year, because, for example, of the central government's increased borrowing from abroad. Other liabilities have also increased. The significance of financial derivatives in gross liabilities has grown considerably compared with March last year. Financial derivatives started to gain in importance since October in both gross liabilities and gross assets, but in net terms their role is limited. |
 |
The value and share of direct investment in gross assets, too, has remained almost the same as a year ago. The stock of portfolio investment has dropped by about 20%, and their share of gross assets has declined to less than a third. The falling valuations of listed companies are also reflected in equity investment, and the value of their stock has decreased compared with March last year. Investments in debt securities have also declined. Gross assets have been boosted by financial derivatives, as in the case of liabilities.
At the end of March, excluding equity items, Finnish residents' external liabilities were EUR 22,5 bn more than their external assets.
1 BOP goods trade data differ from the Board of Custom’s foreign trade statistics because of freight and insurance cost adjustments: in BOP statistics, the share of foreign carriers and insurers is deducted from the Board of Customs’ CIF-based goods imports and added to transportation and insurance costs.
Finland's balance of payments
Year 2008, |
February 2009, EUR million |
March 2009, EUR million |
12 month moving sum, EUR million | |
| Current account | 3,789 | 226 | -353 | 1,822 |
| Goods | 6,192 | 192 | 148 | 5,157 |
| Services | 778 | -69 | -85 | 334 |
| Income | -1,623 | 25 | -241 | -2,111 |
| Transfers | -1,559 | 78 | -174 | -1,559 |
| Capital account* | 165 | – | – | – |
| Financial account | 7,821 | 2,163 | 5,391 | 20,784 |
| Direct investment | -3,979 | -973 | -513 | -1,161 |
| Portfolio investment** | 4,939 | 924 | 7,457 | 23,347 |
| Other investment | 5,466 | 1,051 | -1,475 | -6,606 |
| Reserve assets | -192 | -71 | 108 | 97 |
| Financial derivatives | 1,587 | 1,232 | -187 | 5,106 |
| Errors and omissions | -11,774 | -2,389 | -5,038 | -22,729 |
The statistics become final more than two years after the end of the reference year.
* Capital account is not estimated monthly. The figures are published first after the yearly data are prepared.
** Beginning with the data on the stock of portfolio investment in December 2008, the statistics on portfolio investment are based on security-by-security data collection. Because of the change in statistical methodology, the figures from January onwards are not entirely comparable with earlier periods.
More information
Anne Turkkila +358 10 831 2175, email firstname.surname(at)bof.fi