Finland's current account surplus at EUR 1.20 bn in June
Current account
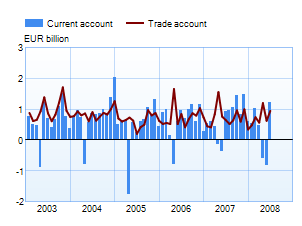
The current account posted a surplus of EUR 1.20 bn in June 2008. A year earlier, in June 2007, the current account was a surplus of EUR 0.91 bn. For the twelve months July 2007 – June 2008 the current account recorded a surplus of EUR 8.13 bn.
In BOP terms, there was a EUR 0.95 bn surplus on goods and a EUR 0.03 bn deficit on services in June 2008. The income account posted a surplus of EUR 0.35 bn, and the current transfers account a deficit of EUR 0.07 bn.
Financial account, flows
Net capital outflows exceeded inflows by EUR 0.74 bn in June 2008. Outward and inward direct investment both fell by EUR 0.43 bn. Portfolio investment was outward on net, in the amount of EUR 0.74 bn. External assets increased by EUR 1.77 bn and liabilities by EUR 1.03 bn. Other investments (loans, deposits, trade credits and other items) resulted in a net capital outflow of EUR 0.17 bn.
International investment position, stock
Finland’s net international investment position at the end of June 2008 was a negative EUR 14.88 bn, ie liabilities exceeded assets. At the end of June 2008, Finnish residents' external assets and external liabilities totalled EUR 396 bn and EUR 411 bn, respectively.
The external liabilities of non-financial corporations, monetary financial institutions (MFIs), central government and local government exceeded their external assets. Equity-items accounted for most of the liabilities of non-financial corporations. In contrast, the external assets of the central bank, other financial institutions, employment pension funds and households exceeded their external liabilities.
At the end of June 2008, Finland's net international investment position excluding equity items was a negative EUR 0.31 bn.
| June 2007, EUR million |
May 2008, EUR million |
June 2008, EUR million |
12 month moving sum, EUR million | |
| Current account | 911 | -832 | 1,198 | 8,132 |
| Goods | 645 | 626 | 945 | 8,617 |
| Services | -128** | -53 | -34 | 460 |
| Income | 460 | -1,227 | 352 | 439 |
| Transfers | -66 | -178 | -66 | -1,384 |
| Capital account* | – | – | – | – |
| Financial account | -2,381 | 2,809 | -739 | -2,585 |
| Direct investment | -726 | 1,890 | -3 | -55 |
| Portfolio investment | -796 | 58 | -745 | -8,142 |
| Other investment | -841 | 661 | -174 | 8,639 |
| Reserve assets | -5 | 5 | -12 | -408 |
| Financial derivatives | -13 | 195 | 195 | -2,619 |
| Errors and omissions | 1,457 | -1,976 | -458 | -5,633 |
The statistics become final more than two years after the end of the reference year.
* Capital account is not estimated monthly. The figures are published first after the yearly data are prepared.
** According to the revised timetable for the balance of payments, 2007 data on the services balance will be adjusted on 15 September 2008.
More information
Veera Vuorinen tel. +358 10 831 2412, email firstname.surname(at)bof.fi