Current account posts EUR 0.51 bn surplus in March
Current account
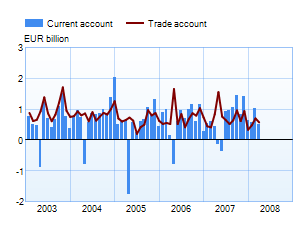
The current account posted a surplus of EUR 0.51 bn in March 2008, compared with EUR 0.42 bn in the same period the previous year. For the twelve months April 2007 – March 2008 the current account recorded a surplus of EUR8.75 bn.
In BOP terms, there was a EUR 0.57 bn surplus on goods and a EUR 0.05 bn deficit on services in March. The income account posted a surplus of EUR 0.15 bn, and the current transfers account a deficit of EUR 0.16 bn.
Financial account, flows
Capital inflows in March exceeded outflows by EUR 0.76 bn. There was a EUR 2.90 bn net outflow of capital in the form of direct investment. The stock of outward direct investment increased by EUR 2.26 bn, while the stock of inward direct investment decreased by EUR 0.64 bn. Portfolio investment was outward on net, in the amount of EUR 0.61 bn: external assets increased by EUR 0.52 bn, while liabilities decreased by EUR 0.08 bn. Other investments (loans, deposits, trade credits and other items) resulted in a net capital inflow of EUR 5.59 bn. Claims grew by EUR 4.71 bn, and liabilities by EUR 10.30 bn.
International investment position, stock
An analysis of Finland’s net international investment position at the end of March shows that Finnish residents' external liabilities were EUR 25.79 bn more than their external assets. External assets totalled EUR 385 bn, while liabilities totalled EUR 410 bn.
The external liabilities of non-financial corporations, monetary financial institutions (MFIs), central government and local government exceeded their external assets. Equity-related liabilities accounted for most of the debt accumulated by non-financial corporations. In contrast, the external assets of the central bank, other financial institutions, employment pension funds and households exceeded their external liabilities.
Finland’s net international investment position excluding equity items at the end of March was a positive EUR 3.71 bn.
| Year 2007, EUR million |
February 2008, EUR million |
March 2008, EUR million |
12 month moving sum, EUR million | |
| Current account | 8,221 | 1 018 | 514 | 8,751 |
| Goods | 8,662 | 702 | 573 | 8 718 |
| Services | -140 | -39 | -49 | 329 |
| Income | 1,084 | 306 | 151 | 1 089 |
| Transfers | -1,385 | 50 | -161 | -1,385 |
| Capital account* | 173 | – | – | – |
| Financial account | -7,644 | -192 | 764 | -9 198 |
| Direct investment | -107 | 407 | -2 902 | -2 560 |
| Portfolio investment | -7,790 | -4 520 | -606 | -6 360 |
| Other investment | 959 | 4 200 | 5 587 | 2 260 |
| Reserve assets | -227 | -72 | -150 | -522 |
| Financial derivatives | -479 | -207 | -1 165 | -2 016 |
| Errors and omissions | -750 | -827 | -1 278 | 317 |
The statistics become final more than two years after the end of the reference year.
* Capital account is not estimated monthly. The figures are published first after the yearly data are prepared.
More information
Jaakko Suni tel. +358 10 831 2454, Veera Vuorinen tel. +358 10 831 2412, email firstname.surname(at)bof.fi