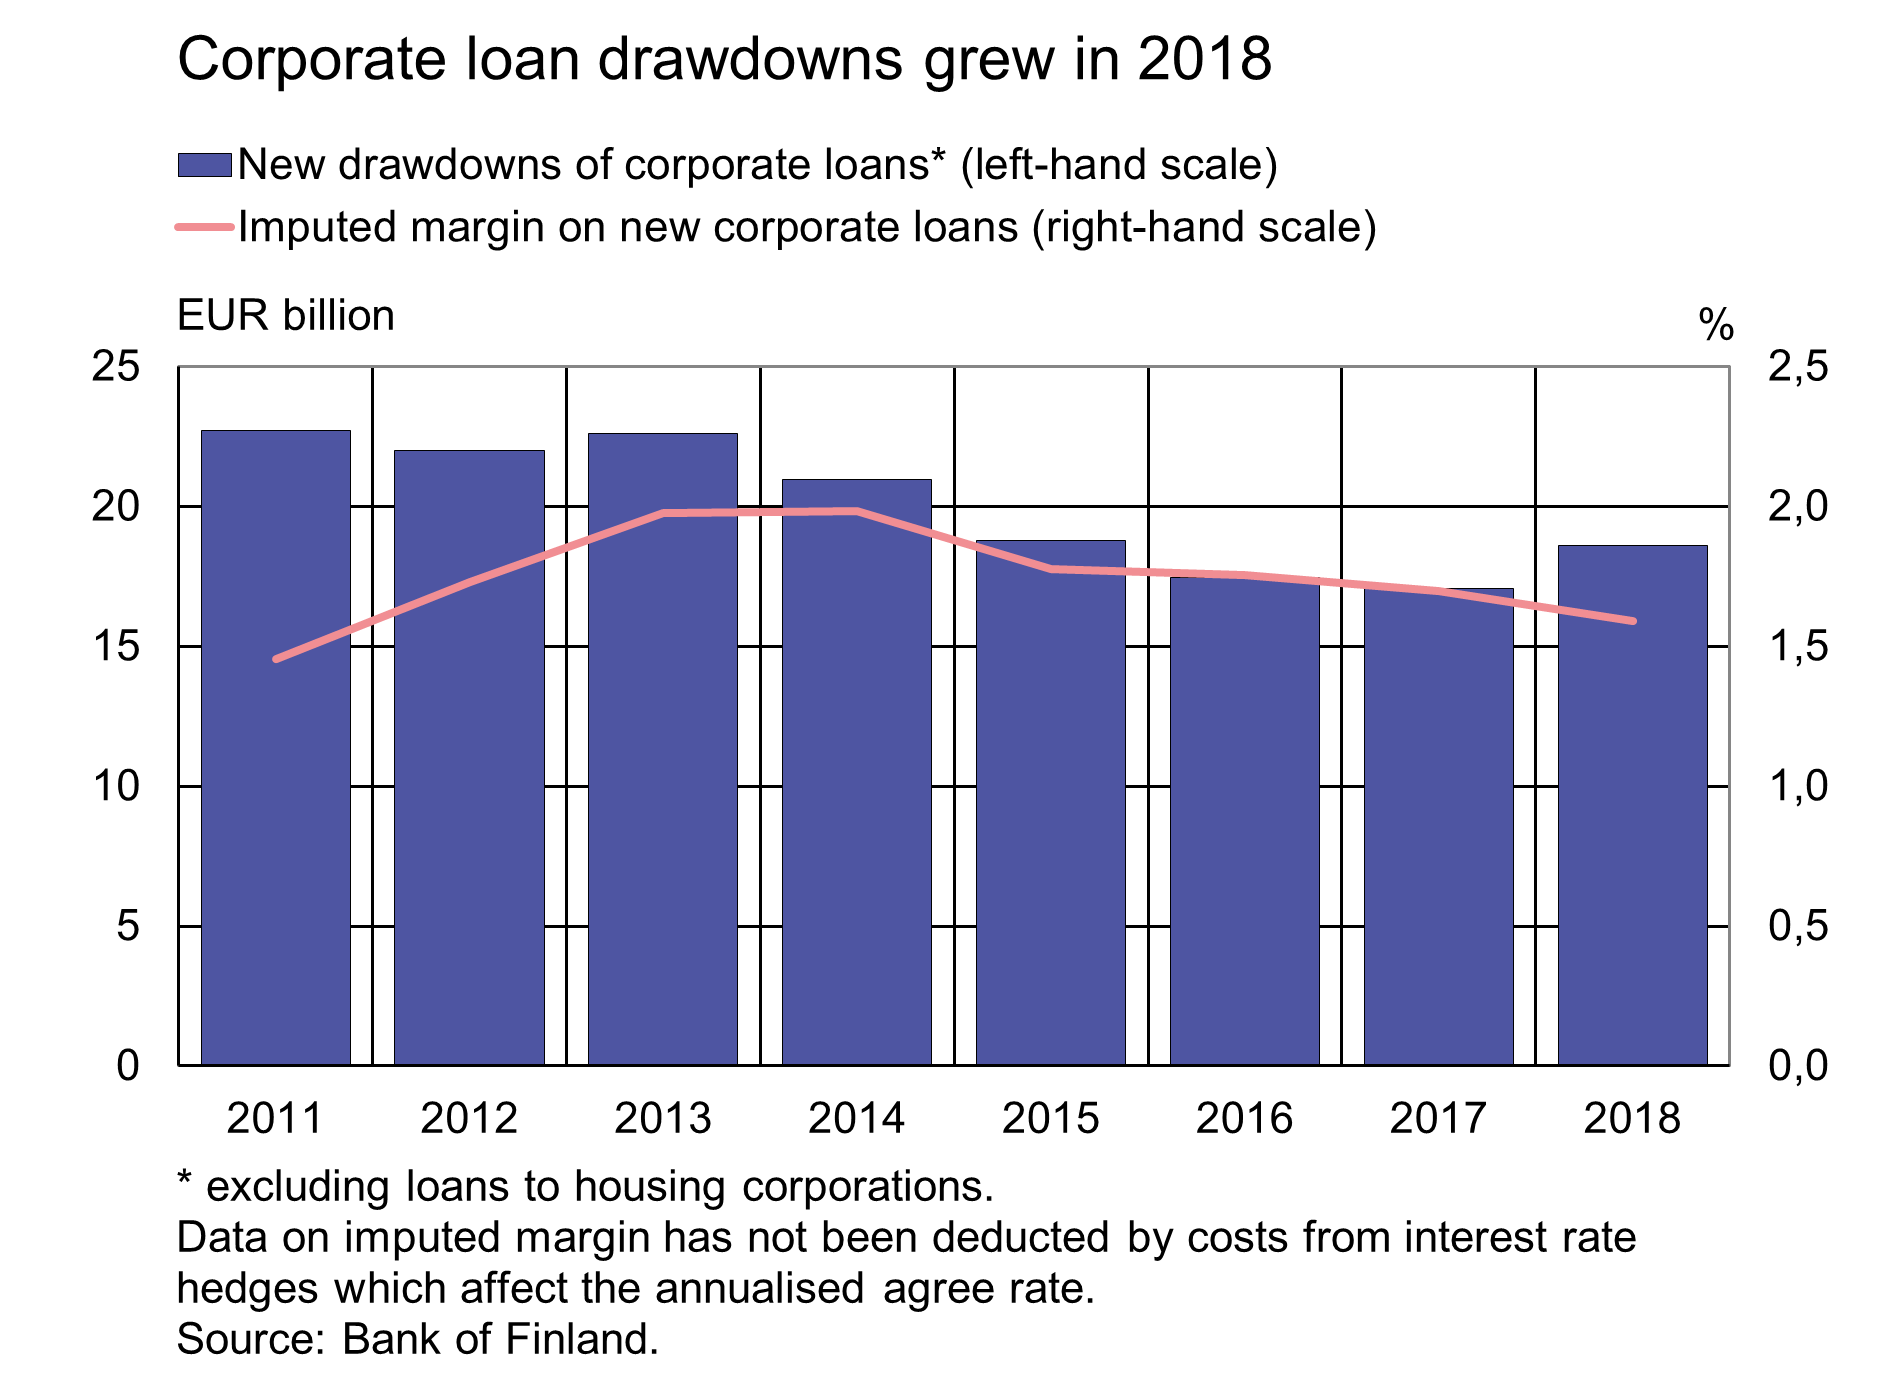
A lively year in the corporate loan market
In 2018, Finnish non-financial corporations (excl. housing corporations) drew down EUR 18.6 bn worth of loans from credit institutions operating in Finland. This was the largest amount in three years and EUR 1.5 bn more than in 2017. There was also a shift in the size of loans in 2018, as growth was recorded in the share of the largest loans (over EUR 1 million) in all loans drawn down during the year.Their share was 62.0%, as opposed to 60.9% in 2017. Compared with the previous year, drawdowns grew in particular in the professional, scientific and technical activities sector, the real estate sector and the administrative and support services sector.
At the end of 2018, the stock of loans to non-financial corporations (excl. housing corporations) totalled EUR 53.4 bn. The corporate loan stock grew by EUR 2.7 bn during the year, the largest amount since 2011. The annual growth rate of the stock peaked in November (6.1%), but moderated somewhat thereafter, to 5.4% in December. Growth in the corporate loan stock was broadly based across economic activity sectors. As in the previous two years, the stock of loans to electricity and steam supply companies grew the most, but particularly high growth rates were also recorded for companies in the administrative and support services sector.
The interest rates on new corporate loans fell marginally in 2018. The imputed margin on corporate loans drawn down in 2018 was 1.59%, which was 0.1 percentage point lower, on average, than the imputed margin on loans drawn down in 2017. The average interest rate on the corporate loan stock, in turn, remained almost unchanged on the previous year (1.61% in December 2018).

Loans
Households’ new drawdowns of housing loans in December 2018 amounted to EUR 1.2 bn, roughly the same as in the corresponding period a year earlier. The average interest rate on new housing-loan drawdowns was 0.87% and the imputed margin was 0.85%. At the end of December, the stock of euro-denominated housing loans totalled EUR 97.8 bn and the annual growth rate of the stock was 1.7%. Household credit at end-December comprised EUR 15.9 bn in consumer credit and EUR 17.1 bn in other loans.
New drawdowns of loans to non-financial corporations (excl. overdrafts and credit card credit) amounted in December to EUR 2.4 bn. The average interest rate on new corporate-loan drawdowns rose from November, to 2.24%. At end-December, the stock of euro-denominated loans to non-financial corporations was EUR 85.3 bn, of which loans to housing corporations accounted for EUR 32.0 bn.
Deposits
The stock of household deposits at end-December totalled EUR 89.1 bn and the average interest rate on the deposits was 0.12%. Overnight deposits accounted for EUR 75.8 bn and deposits with agreed maturity for EUR 5.5 bn of the deposit stock. In December, households concluded EUR 0.4 bn of new agreements on deposits with agreed maturity, at an average interest rate of 0.23%.
| Key figures of Finnish MFIs' loans and deposits, preliminary data | |||||
| October, EUR million | November, EUR million | December, EUR million | December, 12-month change¹, % | Average interest rate, % | |
| Loans to households2, stock | 130,645 | 130,855 | 130,746 | 2,2 | 1,48 |
| - of which housing loans | 97,575 | 97,759 | 97,781 | 1,7 | 0,98 |
| Loans to non-financial corporations2, stock | 84,669 | 85,496 | 85,286 | 7,5 | 1,37 |
| Deposits by households2, stock | 90,875 | 91,172 | 92,785 | 5,6 | 0,11 |
| Households' new drawdowns of housing loans | 1,749 | 1,613 | 1,239 | 0,86 | |
1 Rate of change has been calculated from monthly differences in levels adjusted for classification and other revaluation changes.
2 Households also include non-profit institutions serving households; non-financial corporations also include housing corporations
- Euro-denominated deposits and loans of euro area residents: stock, 12 month rate of change and average interest rate
- Euro-denominated loans and deposits of Finnish households
- New business on loans and new drawdowns of household loans
- Finnish contribution to the euro area monetary aggregates and their main counterparts
- Imputed interest rate margins on loans from MFIs
For further information, please contact:
Olli Tuomikoski, tel. +358 9 183 2146, email: olli.tuomikoski(at)bof.fi,
Ville Tolkki, tel. +358 9 183 2420, email: ville.tolkki(at)bof.fi.
The next news release will be published at 1 pm on 28 February 2019.
Related statistical data and graphs are also available on the Bank of Finland website: https://www.suomenpankki.fi/en/Statistics/mfi-balance-sheet/.